
School practices on discipline and punishment of disruptive behaviour can affect the exclusion rates being recorded and they have been shown to vary across different jurisdictions of the UK. These practices could be closely linked to and shaped by pupil-level characteristics and needs, including free school meals (FSM) eligibility and special education needs (SEN) provision rates in each school.
FSM and SEN rates have been associated with poorer educational outcomes and worse future employment outcomes, though this association could vary by the level of SEN being provided to the pupil (eg, statement versus school action). As education practices and government guidelines change over time, it’s important to consider how such changes could affect exclusion rates across Wales.
This blog post is part of a series presenting preliminary findings from the Excluded Lives project – a multi-disciplinary collaboration across multiple UK universities. The study employs qualitative, quantitative and policy-oriented methods to investigate school exclusions across the UK. The findings outlined here are based on secondary data analysis from the WISERD Education Data Lab. We looked at the sampling strategy of local authorities and schools across Wales based on their levels of exclusions (high versus low), which allows for a comprehensive investigation of school exclusions.
What did we do?
In contrast to the previous blog posts which presented findings on pupil-level characteristics, the analyses outlined below are drawn from data aggregated on a school level, aiming to explore potential school effects by local education authority (LEA), while also avoiding any confidentiality issues. The data were acquired from Welsh Government and include aggregated number of fixed-term exclusions for each local authority in Wales of secondary school pupils only for two three-year periods: 2013-2016 and 2016-2019. Younger pupils were excluded due to the low proportion of exclusion rates before secondary school. The relationship between FSM eligibility, SEN provision and exclusion rates on a school level was also investigated.
What did we find?
Figure 1 shows that during the study period, school-level exclusion rates varied significantly by local authority, with Blaenau Gwent and Denbighshire presenting with the highest school-level exclusion rates, while the lowest rates were observed in Ceredigion and Gwynedd.
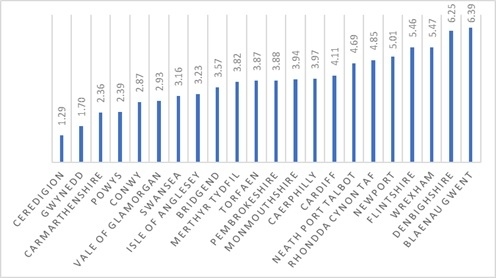
Figure 1. School-level exclusion rates by local authority between 2013-2019
As we aimed to identify schools with pupils at a greater risk of school exclusion, we further controlled for FSM eligibility and SEN provision, which have been previously linked to exclusion rates. In Figure 2, the y axis represents the average rate of exclusion at the school level and the x axis presents the residuals observed for these rates after controlling for FSM and SEN rates. Some areas, such as Blaenau Gwent and Ceredigion were more influenced by FSM and SEN rates at a school level, while local authorities such as Denbighshire and Gwynedd retained their extreme rates even after controlling for FSM eligibility and SEN provision.
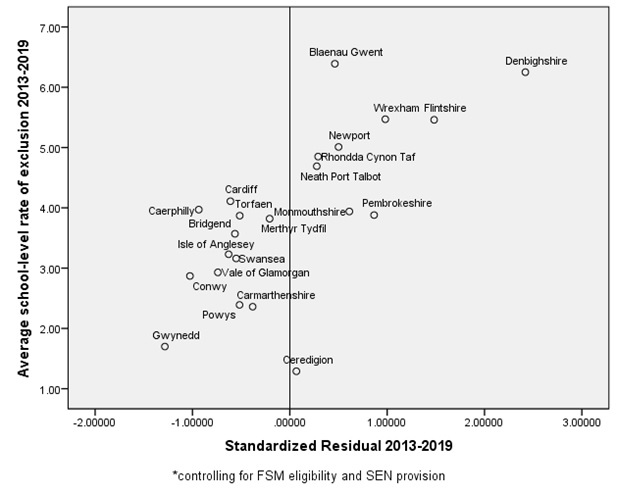
Figure 2. Scatterplot of school-level exclusions by local authority and their residuals after controlling for FSM and SEN level (2013-2019)
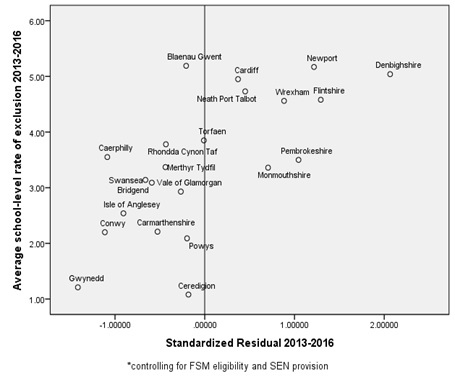
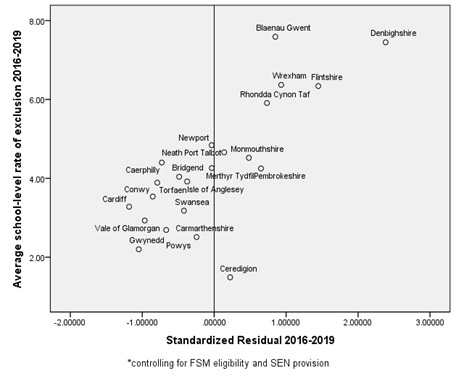
We also explored the differences between 2013-2016 and 2016-2019 with the aim to study variations across time in more detail. Although Blaenau Gwent remained the most affected (by FSM and SEN rates) high exclusion area and Ceredigion the most affected (by FSM and SEN rates) low exclusion area, some local authorities had significant variation between the two periods with Cardiff shifting from a high to a low exclusion rate and Rhondda Cynon Taf changing from a low to a high exclusion rate between 2013-2016 and 2016-2019. Additionally, in the second period (2016-19) there is less variation of residual (and actual) rates, indicating a more uniform dispensation of exclusions across Wales compared to 2013-16.
Figure 3. Scatterplot of school-level exclusions by local authority and their residuals after controlling for FSM and SEN level (2013-2016 and 2016-2019 respectively)
Overall, using school-level aggregated data, it was shown that FSM and SEN rates were closely linked to school exclusions rates across Wales. This association further aligned over time indicating a potential shift in relevant school-level policies. These variations and interactions are key aspects that need to be taken into consideration when investigating school-level variations of exclusions towards achieving a more in-depth understanding.
What do we plan to do next?
To follow-up the current findings, we are planning to investigate how the type of school exclusion may vary by type of special education need (SEN) and reason for exclusion across pupils. Further steps will include more complex analyses that will allow for the risk factors identified in early school years and how these are linked to school exclusions and education attainment further down the line.
About the WISERD Education Data Lab:
WISERD Education Data Lab undertakes independent analysis of administrative education data, survey data and data linkage, alongside knowledge exchange and public dissemination of findings to inform national debate on some of the most contemporary and pressing educational issues facing Wales.
WISERD Education Data Lab has received support from Administrative Data Research Wales, alongside funding from Welsh Government, Economic and Social Research Council (award: ES/012435/1) and Cardiff University.

![]()
Image credit: CC0 Public Domain, via pxhere.com.