In our last blog post we looked at how WISERD’s free interactive mapping tool UnionMaps reveals the complex patterns in trade union membership that exist across Great Britain. Analysis revealed that the overall downward trend in union density that is observed across Great Britain as a whole masks very different local fortunes for the trade union movement.
In this post, we will explore some case study areas in further detail using detailed geographical data for union membership that is available for over 400 areas from UnionMaps.
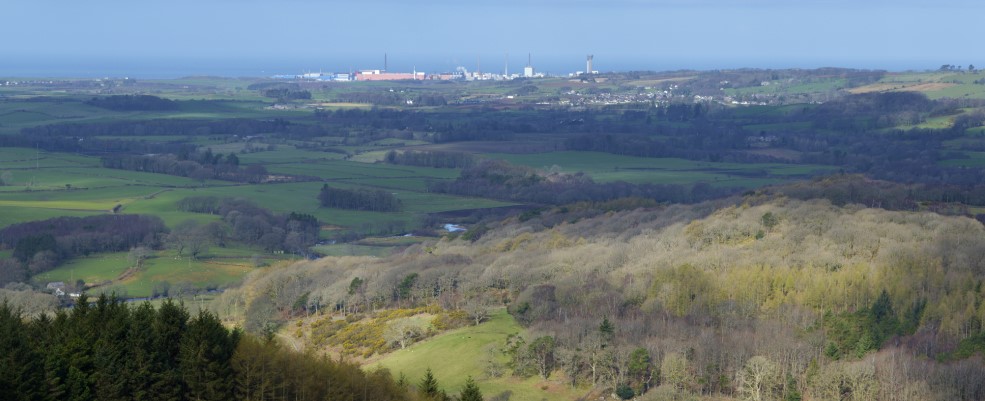
The Cumbrian Coastal Plain – the most unionised area of Britain
Copeland is the most unionised place in Great Britain. Located on the West Cumbrian coastal plain, the Sellafield nuclear processing facility (pictured above) has provided an important source of employment for a highly unionised workforce since the 1950s.
Between 2000/10 and 2011/21, union density in Copeland fell by less than 1 percentage point from 54% to 53%. Towards the north of Copeland, the Cumbrian coalfield used to extend from Whitehaven into the neighbouring area of Allerdale. In addition to Allerdale’s mining heritage, many workers linked to the nuclear sector live here. Union density in Allerdale increased from 42% to 49% between 2000/10 and 2011/21 making it the 2nd most unionised place in Great Britain.
Just to the south of Copeland, Barrow-in-Furness is home to BAE systems where another unionised workforce is largely responsible for building the UK’s fleet of nuclear submarines. Between 2000/10 and 2011/21, union density in Barrow-in-Furness is estimated to have increased from 37% to 41% making it the 4th most unionised place in Great Britain.
The North East – freefalling
Nowhere in Great Britain has the decline in union membership been starker than in North East England, where union density has declined from 40% to 29% between 2000/2 and 2019/21. The largest declines have been witnessed within Northumberland, where the neighbouring areas of Berwick-upon-Tweed (ranked 180th in 2000/10) and Alnwick (ranked 50th in 2000/10) experienced falls in union membership of 51% and 35% respectively. In the south of the region, union density in Redcar and Cleveland has fallen from 42% to 29%, resulting in a decline in its rank position from 10th to 82nd.
Despite exhibiting a large decline in union density from 44% in 2000/10 to 34% in 2011/21, Durham remains the 24th most unionised place in Great Britain. Areas within the region where reductions in union membership have been more modest include Sedgefield (34% to 30%), Chester-le-Street (40% to 36%) and Wansbeck (41% to 36%). Teesdale is also estimated to have experienced a 65% increase in union density (22% to 36%). This very extreme increase, which is in contrast to its neighbouring areas, could in part be due to the small sample sizes upon which estimates for this rural area are based.
Wales – diverging urban and rural trends
While the South Wales Valleys have also exhibited reductions in rates of union membership, their decline has been more moderate than that witnessed within the old industrial areas of North East England. The South Wales Valleys remain among the most highly unionised places in Great Britain, although their rank positions have fallen marginally (Merthyr Tydfil from 4th to 5th; Neath Port Talbot from 3rd to 8th and Rhondda Cynon Taff from 7th to 9th). One exception to this is Blaenau Gwent which has experienced a decline comparable to those observed in the North East, falling from 44% during 2000/10 to 33% in 2011/21. This represents a fall in its rank position from 6th to 30th. In another old mining area, union membership in Wrexham has also fallen from 39% to 30%, a decline of almost a quarter.
More remarkable however has been the increase in union membership that has occurred across rural areas. Union density has increased in Denbighshire from 32% to 35%, in Ceredigion from 32% to 34%, in Conwy from 29% to 30% and in Carmarthenshire from 37 to 38%. Union membership in Pembrokeshire has also remained unchanged at 33% and has fallen only marginally within the Vale of Glamorgan from 34% to 33%.
In the face of declining union membership elsewhere, such changes have resulted in significant upward shifts in the relative positions of these areas. Denbighshire has moved from the 99th to the 17th most unionised place in Britain, Ceredigion has moved from 112th to 27th and Carmarthenshire has moved from 45th to 11th.
The South Downs – on the up
South East England is characterised by low levels of union density, falling from 22% in 2000/10 to 19% in 2011/21. However, across the South Coast there is a large cluster of areas that have each exhibited either an increase or relative stability in their rates of union membership.
Moving eastwards from Hampshire across the southern edge of the South Downs National Park, union density has increased or remained stable in Test Valley (20% to 21%), Winchester (20% to 21%), East Hampshire (18% to 19%), Chichester (17% to 18%), Arun (stable at 20%), Worthing (22% to 24%), Adur (22% to 25%), Mid Sussex (stable at 21%) and Brighton (stable at 27%). Although these increases are not large and union membership in these areas was low to start with, many other areas in London and the South East with comparable levels of union density have exhibited far greater declines.
UnionMaps reveals the complex patterns and trends in union membership that exist across Great Britain and how these have changed over recent decades. Whilst it is undoubtedly the case that union membership remains higher in areas that were once characterised by traditional unionised sectors, variations in local trends demonstrate the need for detailed place-based analysis in order to understand the changing fortunes of trade unions across different parts of Great Britain and point to potential importance of place-based approaches to supporting the revitalization of the labour movement.
Why not visit UnionMaps to find out how high union membership is where you are?
This research is based on work undertaken in relation to the WISERD Civil Society Research Programme Changing perspectives on Civic Stratification and Civil Repair funded by the ESRC (ES/S012435/1).