
Pupil needs can vary significantly and might require for the provision of individually tailored special education and/or additional support. Special education needs (SEN) have been linked with a number of adverse outcomes including poor mental health and loss of school days, which in turn can lead to deterioration of mental health, highlighting the need to identify and support pupils with SEN.
Although the term “special education needs” is quite broad and covers a range of diverse needs (including medical and learning difficulties), when considering pupils with identified SEN, all types of needs are usually grouped together, potentially masking the underlying differences across different pupils.
This blog post is part of a series presenting preliminary findings from the “Excluded Lives” project – a multi-disciplinary collaboration across multiple UK universities. The study employs qualitative, quantitative and policy-oriented methods to investigate school exclusions across the UK. These analyses, carried out in the WISERD Education Data Lab, focuses on the variation of special education needs identified across pupils in mainstream education in Wales and how this might vary across academic years.
What did we do?
We used data on special education needs identified between 2009/10 and 2016/17. Each pupil might have had multiple types of needs, but the one with the most profound impact on the child’s educational progress is marked as “primary” to prioritise it over other comorbid difficulties which are classified as “secondary” SEN. While the previous blog post focused on the “primary” SEN type, here we accounted for all SEN types irrespective of the level of need identified.
SEN type was grouped into autistic spectrum, mental health, special learning (dyspraxia, dyslexia, dyscalculia, ADHD), general learning, sensory (hearing, visual and multi-sensory impairment), moderate learning, severe and multiple learning, speech and language, physical and medical difficulties. We further investigated how the identification and frequency of these types of need can vary across different key stages of education.
What did we find?
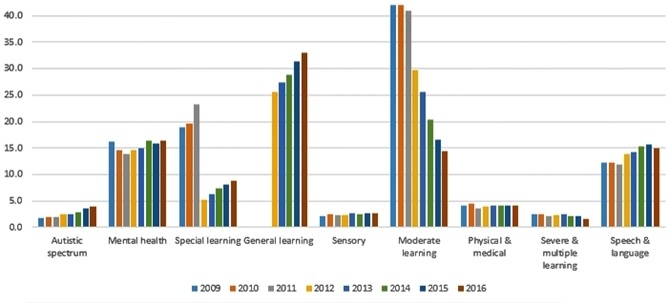
When accounting for all types of need identified across our whole pupil population (Figure 1), it was noted that the frequency of different SEN types can vary significantly across time. It’s important to note that in 2012, the coding of special learning difficulties changed into multiple distinct groups, including dyslexia and dyspraxia, and general learning difficulties were first introduced as a category.
The variation of different needs being identified is particularly evident for autistic spectrum SEN, which has shown a stark increase especially in later years (from 1.8% in 2009 to 4% in 2016), while the opposite was observed for moderate learning difficulties which saw a sharp decrease (from 42.3% in 2009 to 14.5% in 2016). Interestingly, mental health SEN presented with a U-shape distribution which started with a decrease before rising again in the last three years, which could be linked to changes in provision policy on a school and/or local authority level.
Figure 1. Type of need across academic years (annual proportion of types of need)
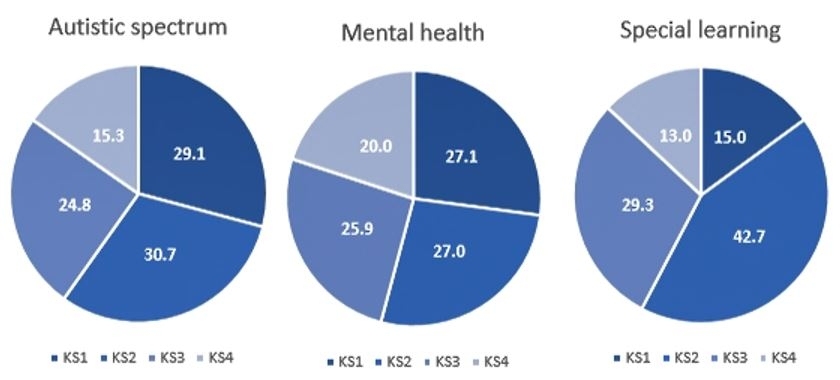
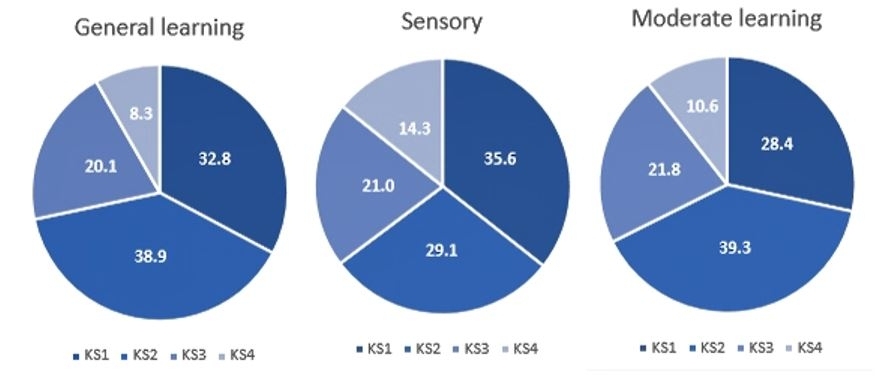
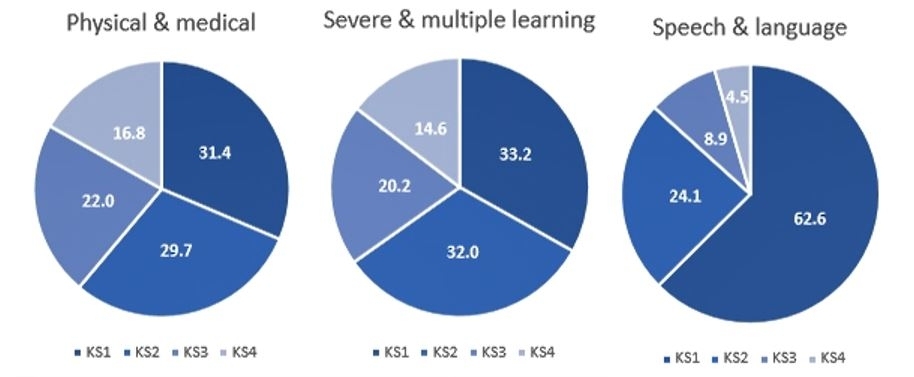
We next explored at which key stage each SEN type was first identified (Figure 2). Different types of need were identified at different key stages, with learning needs being primarily identified during Key Stage 2 (particularly for special and moderate learning SEN), while physical and sensory needs were identified during Key Stage 1 (particularly for speech and language SEN).
Mental health needs were more evenly identified across all four key stages even up to Key Stage 4, suggesting that the level of difficulty caused by mental health conditions could differ from other SEN types. In addition, we investigated how this relationship changed over the time period available.
It was noted that across most types of need, SEN was identified sooner (mainly Key Stage 1 and 2) in more recent years. This might indicate that pupil needs are being identified more effectively in earlier stages of education, possibly decreasing the negative effect of unidentified needs on the pupil in the long-term.
Figure 2. First identification of different types of needs (proportion of types of need in graded colour from darker blue for Key Stage 1 to lighter for Key Stage 4)
Overall, these analyses highlight the variations across different types of need, and subsequently the different levels of provision required, across different educational stages. The improvement of early identification of SEN across types of need, along with the introduction of new SEN types, could facilitate the adaptation of the learning process to the pupil’s needs.
What do we plan to do next?
We plan to further explore the interplay between different types of SEN, as well as the potential interaction between pupil “primary” and “secondary” needs. These analyses will look into how complex needs might change across academic years and how they might be linked to the pupil’s educational pathway.
About the WISERD Education Data Lab:
WISERD Education Data Lab undertakes independent analysis of administrative education data, survey data and data linkage, alongside knowledge exchange and public dissemination of findings to inform national debate on some of the most contemporary and pressing educational issues facing Wales.
WISERD Education Data Lab has received support from Administrative Data Research Wales, alongside funding from Welsh Government, Economic and Social Research Council (award: ES/012435/1) and Cardiff University.
The statistics used in this report have been approved for publication by SAIL. This does not imply Welsh Government’s acceptance of the validity of the methods used to obtain these statistics, or of any analysis of the results. Rather, they have been deemed to be non-disclosive (i.e. individual pupils cannot be identified).

![]()