Following nearly a decade of austerity, local authorities face funding challenges that are having major impacts on the ways public services are delivered. Financial pressures, combined with increasing demand and expectations from the public for accessible and timely services, are having a detrimental effect on those social groups most reliant on essential facilities.
In our recently published paper, we show how mapped outputs from a geographic information system (GIS)-based spatial analysis can be used to explore the geographical implications of changes in service provision; using the example of provision in public libraries.
In previous research we demonstrated how similar techniques were used to examine the accessibility implications of changes to post offices, sport facilities and primary care facilities. In each study, the outputs from GIS have provided useful insights into the areas of Wales that have been disproportionately impacted by such changes and have enabled further study of such disparities in relation to a range of socio-demographic variables.
As a GIS scientist, I may be (slightly) biased in advocating that mapping outputs from the use of such applied analytical tools are vitally important vehicles with which to discover and understand the spatial impacts of policy decisions. However, can they singularly provide a complete picture of the impacts of such cuts on individual households and communities? Arguably not.
In our latest paper, we show how GIS tools can be used to measure accessibility to libraries before and after budgetary constraints (see Figure 1) and enable us to model the implications of changes in ownership or management of the facilities to community groups or not-for-profit organisations.
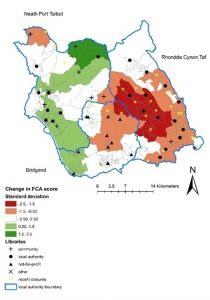
Factors such as changes to the opening times of libraries that remain following a closure programme can be included in this type of analysis, as can patterns of accessibility compared to socio-economic patterns of deprivation.
Despite growing awareness of how GIS and spatial analysis can be used in such areas, we conclude the paper by suggesting that more research is needed to integrate these findings with, for example, qualitative studies that can capture the day-to-day experiences of those affected by the loss of public services in their community.
Several studies have shown how outputs from ethnographic studies can be integrated within qualitative GIS frameworks and these provide an important starting point. Nevertheless, as a recent commentary by the urban geographer Elizabeth Delmelle for the journal Geographical Analysis has highlighted, few mainstream GIS packages incorporate a “qualitative toolbox” which permit the outputs from such data sources to be integrated with map-based tools to help explain the “unequal landscapes of opportunity” associated with inequalities in service provision.
At a time when we are constantly reminded of the need for “socially impactful” research, and have access to an increasing proliferation of sources, Delmelle draws attention to the potential for mixed methods perspectives that permit a wider understanding of the “messiness of social reality”.
While the benefits and challenges of integrating GIS-based accessibility models with ethnographic techniques in studies of community-level changes in public service provision are generally under-researched, a clear argument could be made that the actual impact on individuals or communities tends to be overlooked or under-played within existing approaches.
In the context of our research on the impacts of changing provision of services, there are at least two advantages of a closer integration of these sets of approaches which would help provide greater insights regarding the impacts of austerity.
Firstly, outputs from a GIS can help researchers choose the most appropriate communities or localities for further in-depth research, by acting as a ‘contextual backdrop’ for more detailed, ethnographic studies.
Secondly, as GIS analysts, we often include assumptions or anecdotal evidence regarding the actual use of services in order to model patterns of ‘consumer’ behaviour. Although sensitivity analysis is often incorporated within these approaches to account for access via alternative modes of transport for example, we often lack service utilisation data on how far people are prepared to travel to access services, on the frequency of their use and on the service quality factors that impact on their preferred choice of provider. This emphasises the need for data to be interpreted only as potential measures of accessibility that are rarely informed by, or validated with, revealed patterns of the actual use of services by different population groups.
Increased integration of data with that of for example GPS trackers, travel diaries or Smartphone apps with interview data could, assuming appropriate ethical protocols, permit a more accurate modelling of a person’s ‘activity space’ which account for the complex choices individuals or families make in their daily living and working routines, in the light of the constraints (time, financial, cultural, etc.) they are under.
This in turn will aid the calibration of the models in the GIS-approach used to examine changes in service provision, provide a more realistic appraisal of patterns of service utilisation and ultimately help enable a wider appreciation of the lived experience following austerity-driven cuts in public services. Such laudable aims provide the rationale for our continuing research in this area and the need to create the most detailed picture we possibly can of how austerity looks on the map.