
Mae'r cynnwys hwn ar gael yn Saesneg yn unig.
There is evidence to suggest that school exclusions can have negative effects on children’s lives. Exclusions have been associated with poor educational outcomes, and long-term physical and mental health problems. We need to investigate how patterns of exclusions and characteristics of excluded pupils differ across time and can help to inform current understanding of possible risk factors.
This blog post presents preliminary findings from the Excluded Lives project – a multi-disciplinary collaboration across multiple UK universities. The study employs qualitative, quantitative and policy-oriented methods to investigate school exclusions across the UK. Our analysis, carried out in the WISERD Education Data Lab, specifically explores pupil records for children in mainstream education in Wales (not accounting for pupil referral units), to identify key factors linked to school exclusions.
What did we do?
By focusing on school exclusions as distinct events, we investigated school exclusion patterns over an eight-year observation period (2011/2012 to 2018/2019). We explored the number of instances and length of school exclusions to provide a better understanding of trends across the study period. For these analyses, school exclusions were grouped as fixed-term (during which a child is temporarily removed from school for a period of up to 45 school days in one academic year) and permanent (occurring when a child is expelled from school). Whilst we know that lunchtime exclusions are also used in schools, recording of these is patchy in our data and so were not included here.
What did we find?
School exclusion instances
A total of 122,790 school exclusion instances were recorded in Wales during the eight-year observation period. An increase of school exclusion instances, in line with the number of school-aged children and irrespective of type of exclusion, was observed between 2013/2014 (13,202) and 2018/2019 (19,317), despite a decrease the preceding year (2011/2012: 15,013). Furthermore, an increasing proportion of recorded school exclusion instances were permanent, rather than fixed term (2011/2012: 0.6% → 2018/2019: 1.3%).
Additionally, we explored how the length of fixed-term exclusion instances changed over time (Figure 1). Interestingly, in contrast to the increasing number of recorded fixed-term exclusion instances, a decrease was observed in relation to fixed-term exclusions of three or more days, indicating that although the number of instances went up, this was possibly precipitated by more frequent use of short-term exclusions. Indeed, this can be seen with an increase in shorter fixed-term exclusion instances, more prominent in the “up to 1 day” category.
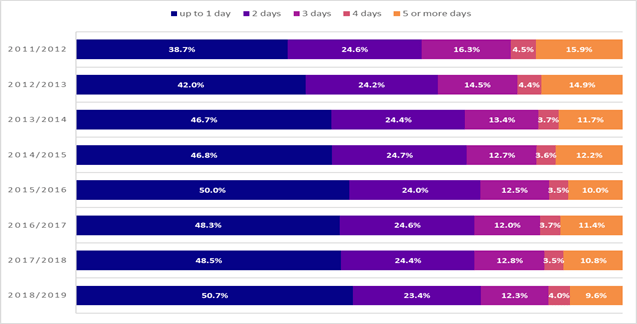
Figure 1. Length of exclusion (Percentages) per fixed-term exclusion instances by academic year
Excluded pupils
In line with more exclusion instances, we also observed an increasing number of pupils being excluded in Wales. In addition, the proportion of pupils who have been permanently excluded doubled during the study period (2011/2012: 1.2% → 2018/2019: 2.6%).
In terms of the total number of days lost to exclusion per year, a U-shaped trend was noted, with an increasing number during the four latter years, peaking at 41,073 days lost in 2018/19 (Figure 2).
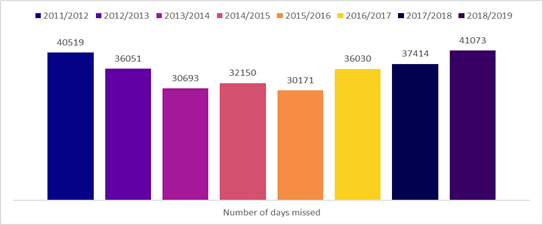
Figure 2. Number of days lost to exclusion by academic year
Following the investigation of overall number of days lost to exclusion, the cumulative number of days missed per excluded pupil each academic year was also calculated (Figure 3). The following figure presents findings on fixed-term exclusions only, as permanent exclusions are recorded as having a length of 0 days. In keeping with the trend seen in relation to the length of fixed-term exclusions, an increasing trend was observed within groups of excluded pupils missing up to one day (from 26.1% in 2011/12 to 32.3% of excluded pupils in 2018/19). There was an overall reduction of the proportion of excluded pupils missing more than five days due to fixed-term exclusions.
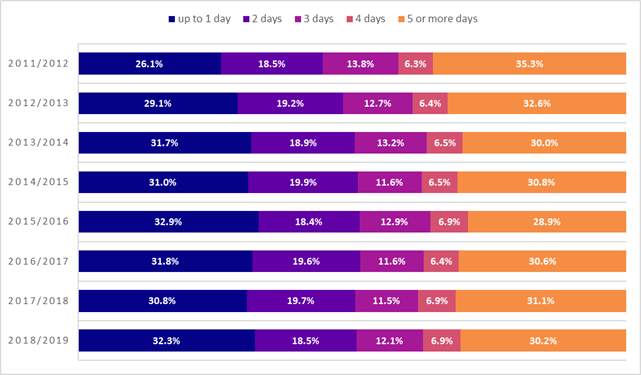
Figure 3. Cumulative number of days (Percentages) missed per pupil by academic year
Our preliminary analysis has highlighted that the number of school exclusions recorded over the eight-year observation period has increased overall.
There was a trend of more students being excluded over time for shorter periods, which was re-affirmed when we looked at the cumulative number of days missed by excluded pupils. Thus, while exclusion instances get shorter in length, they can still have a disruptive effect on learning overall.
What do we plan to do next?
We’ll be exploring pupil-specific characteristics, and school- and area-level characteristics of school exclusions. These characteristics (which will include gender, school type and local education authority) will provide a more in-depth understanding of variations in observed school exclusion patterns across the years and will help us identify potential risk factors closely linked to school exclusions.
About the WISERD Education Data Lab:
WISERD Education Data Lab undertakes independent analysis of administrative education data, survey data and data linkage, alongside knowledge exchange and public dissemination of findings to inform national debate on some of the most contemporary and pressing educational issues facing Wales.
WISERD Education Data Lab has received support from Administrative Data Research Wales, alongside funding from Welsh Government, Economic and Social Research Council (award: ES/012435/1) and Cardiff University.
The statistics used in this report have been approved for publication by SAIL. This does not imply Welsh Government’s acceptance of the validity of the methods used to obtain these statistics, or of any analysis of the results. Rather, they have been deemed to be non-disclosive (i.e. individual pupils cannot be identified).

![]()
Image credit: CC0 Public Domain, via pxhere.com.