Today (25th May), the Department of Business Energy and Industrial Strategy (BEIS) released its latest figures for trade union membership. The long-term downward trend in union membership in the UK is well known. Based on union records, trade union membership within the UK peaked in 1979 at approximately 13.2 million. Since then, there has been a precipitous decline, such that there are now around 6.7 million members. Data from the Labour Force Survey reveal that the percentage of employees who are a trade union member (referred to as ‘union density’) has fallen to 23.1%. Following a period of relative stability since 2016, today’s figures represent the lowest rate of trade union membership among UK employees since estimates based on LFS data began in 1995.
Variation between regions
The data also reveal that some parts of the UK remain more prone to unionisation than others. Official estimates for 2021 reveal that across the nations of the UK, union density is highest in Wales (36%), followed by Northern Ireland (31%), Scotland (28%) and finally England (22%). Wales is the only country within the UK that has seen an increase in the rate of trade union membership during the last 12 months, with union density increasing by approximately 4 percentage points. Within England, trade union membership is highest among employees in the North East (29%), North West and Yorkshire and Humberside (both 26%). Within London and the South East, the rate of union membership among employees is estimated to be just 17%. However, there is also considerable variation within regions. For example, within the North West, union density in Merseyside is estimated to be 33%, a figure much higher than that observed in the neighbouring metropolitan county of Greater Manchester (25%). Likewise, there is considerable variation in levels of union membership between different parts of Scotland and Yorkshire.
The historical legacy
It has long been recognised that within areas where there is a historical legacy of trade unionism, workers remain more likely to join trade unions due to the favourable attitudes towards union membership that persist – even among those working in relatively unorganised sectors. However, broad administrative geographies do not capture the importance of historical and cultural factors influencing present-day levels of union membership within particular places and the opportunities that may exist locally for revitalisation of the union movement.
WISERD’s UnionMaps
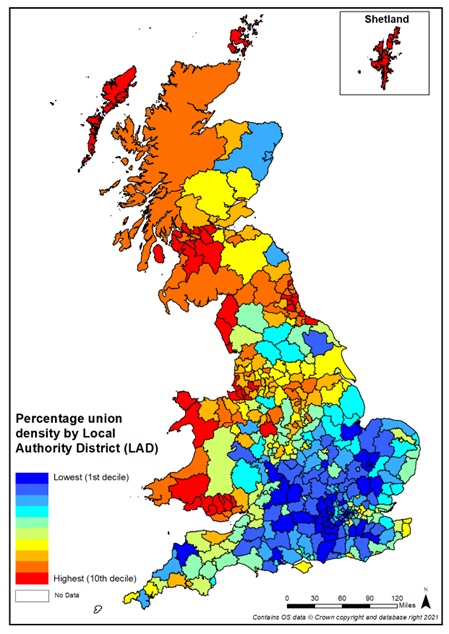
To address this, WISERD’s UnionMaps service presents estimates of trade union membership for Unitary Authority and Local Authority Districts of Great Britain. By pooling data over a period of 20 years, estimates of union membership are produced for over 400 areas. Simply click on the map or use the search tool to produce area reports of union membership for a particular location.
10 most unionised areas in Great Britain
Our data reveals that the 10 most unionised areas in Great Britain are Copeland (54%), Eilean Siar (47%)[1], Barrow-in-Furness (45%), Neath Port Talbot (44%), Merthyr Tydfil (43%), West Dunbartonshire (42%), Rhondda Cynon Taff (42%), Durham (40%), Bridgend (40%) and Allerdale (39%). The prominence of union membership in these areas reflects both the importance of large, unionised workplaces that continue to dominate local labour markets and the lasting significance of highly unionised workplaces that have long since vanished.
[1] Also known as the Outer Hebrides, it is noted that this estimate is based upon a relatively small number of employees (approximately 150) and should therefore be treated with caution. Otherwise, the sample sizes for individual areas upon which estimates are based are generally over 1000.
Union Density by Local Authority District
The most unionised place in Britain
Such effects are clearly demonstrated along the coast of Cumbria. In Copeland, the Sellafield nuclear processing facility has provided an important source of employment for a highly unionised West Cumbrian workforce since the 1950s. Coalmining areas have long been recognised as providing a durable base for the trade union movement. The Cumbrian coalfield used to extend from Whitehaven in the north of Copeland into the neighbouring district of Allerdale, where communities such as Workington were once dominated by coal and steel. Just to the south of Copeland, Barrow-in-Furness is home to BAE systems where another unionised workforce is largely responsible for building the UK’s fleet of nuclear submarines. BAE systems also builds upon a long tradition of unionised employment within the steel and ship building industries in Barrow. These factors combine to make the West Cumbrian coastal plain arguably the most highly unionised place in Britain, with levels of union membership comparable to that of some Nordic countries.
UnionMaps reveals the detailed differences in union membership that exist across the UK. The data reveals that the pattern of union membership more closely resembles a complex patchwork quilt rather than a regional divide. Why not visit UnionMaps to find out how high union membership is where you live?