
Mae'r cynnwys hwn ar gael yn Saesneg yn unig.
Recent waves of strike action by nurses, train drivers, ambulance drivers, university lecturers, teachers and others besides has highlighted the prominent position that trade unions continue to hold within the UK. An important factor that determines the power and influence of trade unions, either within an organisation or across a sector, is the proportion of workers who choose to join. Understanding who joins trades unions and why is therefore important to understanding the strength of the labour movement.
Last summer, the Department of Business Energy and Industrial Strategy (BEIS) released its latest figures for trade union membership. The long-term downward trend in union membership in the UK is well known. Data from the Labour Force Survey reveal that the percentage of employees who are a trade union member (referred to as ‘union density’) has fallen in 2021 to 23.1%. Following a period of stability since 2016, last year’s figures represent the lowest rate of trade union membership since estimates based on LFS data began in 1995.
Despite the overall downward trend in union density, significant geographical variations persist. Within those areas once characterised by highly unionised industries such as coal, steel and shipbuilding, rates of union membership remain higher than would be expected given the present-day composition of employment. These differences raise the question as to whether the overall decline in union membership has also varied across Great Britain? Has the rate of decline been slower in areas with traditionally high levels of union membership? Are there areas where rates of union membership have remained stable – or even increased?
WISERD’s free interactive mapping tool UnionMaps reveals the complex patterns in trade union membership that exist across Great Britain.
UnionMaps presents various estimates of trade union membership and collective bargaining coverage for Unitary Authority and Local Authority Districts of Great Britain. Using data spanning more than two decades, UnionMaps presents estimates of union membership for over 400 areas across Great Britain. In our most recent refresh, we present new data that charts the change in union membership that has occurred within particular localities.
Figure 1 (below) compares rates of union membership across Great Britain between 2000/10 and 2011/21. Those areas shaded dark red exhibit the highest rates of union membership, those shaded blue – the lowest. There has a been a shift from red towards blue, indicating that rates of union membership have declined in many areas. Between 2000 and 2010, the lowest levels of union density were concentrated to the west and southwest of London. During the following decade, comparable levels of union membership were observed across a majority of areas south of the ‘Severn-Wash’ line. The number of areas that have maintained the highest levels of union membership has also fallen. Where once whole regions exhibited uniformly high levels of union membership, such as across the ‘Central Belt’ of Scotland or North East England, only enclaves now remain.
Figure 1: Union Density in Great Britain 2000/10-2011/21 (% employees)
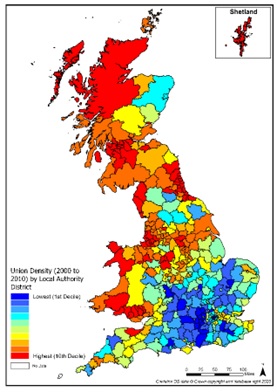
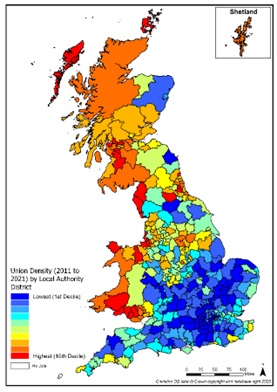
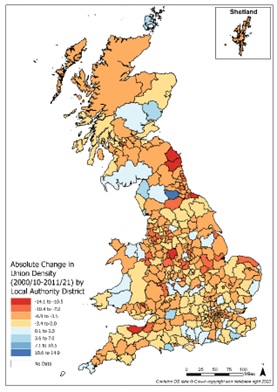
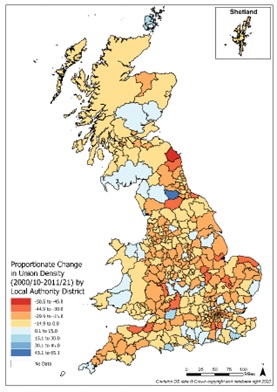
Figure 2 (below) shows estimates of the change in union density between 2000/10 and 2011/21. Areas with higher levels of union density have potentially further to fall and therefore tend to exhibit larger absolute decreases in union membership, as is witnessed in Scotland. However, in proportionate terms, the devolved nations of Great Britain have experienced relatively low reductions in the rate of union membership compared to those observed across large areas of England.
Figure 2: Change in Union Density: 2000/10-2011/21
Absolute Change (% points) Proportionate Change (%)
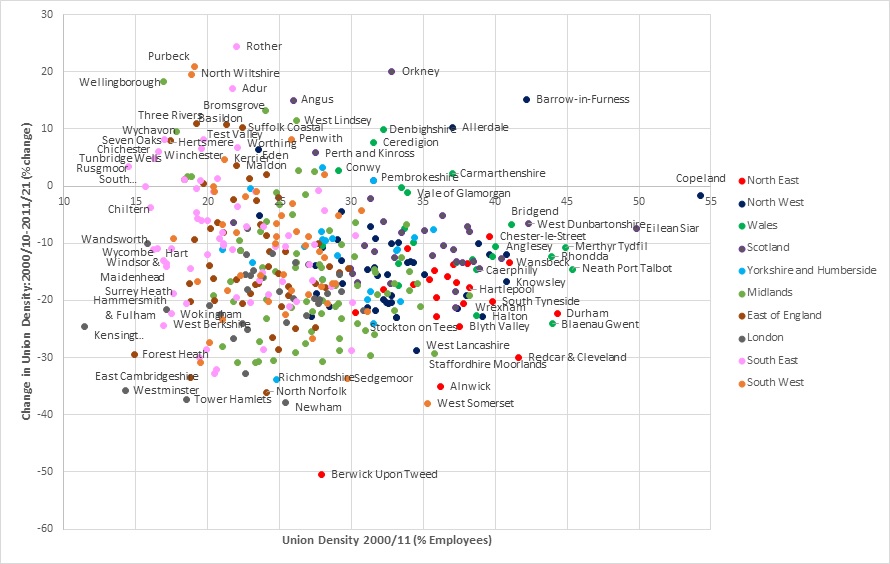
A commonly held idea is that the retreat of trade union membership has been uneven due to the more favourable attitudes that persist towards trade unions in areas once characterised by highly unionised sectors. Figure 3 (below) plots the change in union density that has occurred within areas between 2000/10 and 2011/21 against underlying levels of union membership as measured in 2000/10. There are two take-home messages. Firstly, most of the points lie beneath the horizontal line – reaffirming the decline in union membership that has occurred across most areas. Nonetheless, of the 406 areas presented, 49 experienced either no change or an increase in their union density. Union density has not declined everywhere. Secondly, it can be seen that, overall, there is no relationship between baseline levels of union membership measured in 2000/10 and the changes in union density that subsequently occurred. Whilst in some areas union membership is starting from a higher base, there is no evidence to suggest that the rate of decline in union density is uniformly lower within traditionally high-density areas.
Figure 3: Changes in Union Membership Observed Across
UnionMaps reveals the complex patterns and trends in union membership that exist across Great Britain. The overall downward trend in union density masks very different local fortunes for the trade union movement. Read our next blog post to discover where the most unionised place in Britain is, where union membership is falling fastest and where it is surprisingly on the rise.
Why not visit UnionMaps to find out how high union membership is where you live and how it has changed over recent decades?
This research is based on work undertaken in relation to the WISERD Civil Society Research Programme Changing perspectives on Civic Stratification and Civil Repair funded by the ESRC (ES/S012435/1).